Mouse Cell Atlas
Mus musculus Version3 scRNA-seq
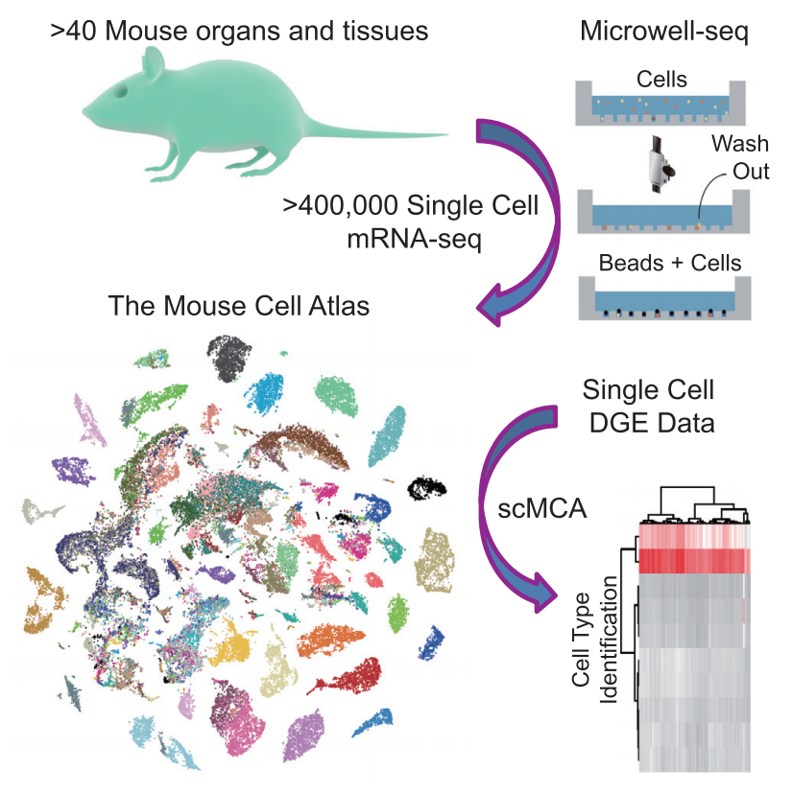
Microwell-seq protocol
Materials
We taught a local company (G-Bio Biotechnology Co. Ltd) to provide Microwell-seq Kit/Service http://www.igeneseq.com/research_detail/dxbcp/microwell.html
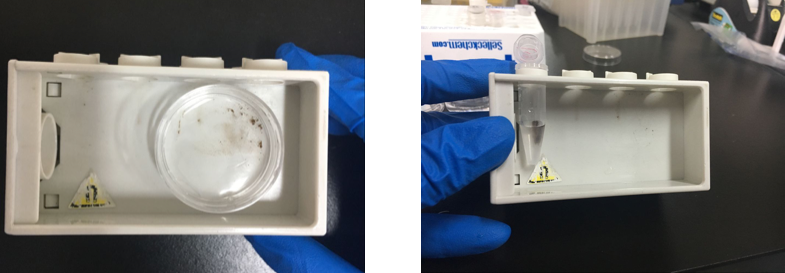
Preparation of beads
Beads were washed twice with 1 ml of 100% EtOH and twice with 1 ml of TE/TW (10 mM Tris pH 8.0, 1 mM EDTA, 0.01% Tween). The bead pellet was resuspended in 1ml TE/TW for long-term storage at 4 ºC. For Microwell- Seq, 50 µl beads suspension was removed from the stock tube, washed twice with 500 µl of DPBS/EDTA (20 mM EDTA), then resuspended in 500 µl of DPBS/EDTA for a bead concentration (1:10, stock bead: bead for use). 500 µl diluted bead suspension was used for one experiment.
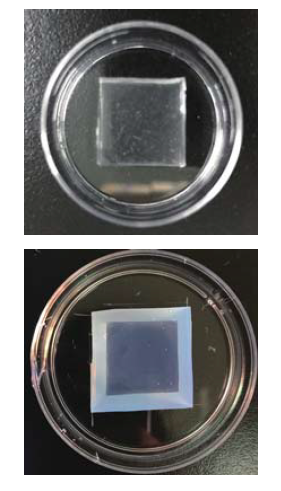
Fabrication of microwell array
PDMS washed once by 100% EtOH, twice by H2O and air drying. Agarose (5%) microwell arrays were cast from the PDMS before each experiment. Agarose microwell arrays could with DPBS/EDTA for short-term storage at 4ºC (in 10 days).

Protocol
Cell collection and lysis
Cell concentration should be carefully controlled in Microwell-seq. Both cell and bead concentrations were estimated by hemocytometer. The proper cell concentration is ~ 170,000 cells/ml (10% wells will be occupied by single cells). Evenly distributed cell suspension were pipetted onto microwell array (5 min~10 min) and extra cells were washed away. To eliminate cell doublets, the microwell plate was inspected under a microscope and microwell with overfull cell doublets can be discarded. Bead suspension(500 µl) was then loaded on the microwell plate which was placed on a magnet. Excess beads were washed away slowly. Cold lysis buffer (0.1 M Tris-HCl pH 7.5, 0.5 M LiCl, 1% LiSDS, 10 mM EDTA, and 5 mM dithiothreitol) was pipetted over the surface of the plate, and removed away after 10 min incubation. Then beads were collected and transferred to an RNase-free tube, washed twice with 200 µl 6X SSC, and once with 200 µl of 5x RT buffer (or 50 mM Tris buffer).

Reverse transcription
Then 20 µl RT mix was added. The RT mix contained dNTP mix (1mM), 100U SuperScript II reverse transcriptase, 1x Superscript II first-strand buffer (Takara, cat #2690A), 10 U Rnase Inhibitor (Lucigen, cat #30281-2 or other brands), 1M Betaine (Sigma, cat #B0300-1VL) and 6 mM MgCl2 (Ambion, cat #AM9539G), 1 µM TSO_RT_primer (see table 1). The beads were incubated at 42ºC for 90 minutes (gently shake beads every 6 min). The beads were then washed once with 200 µl TE-SDS, once with 200 µl TE-TW, and once with 1X exonuclease I buffer (or 10 mM Tris pH 7.5).
Exonuclease I treatment
After washing by 1X exonuclease I buffer, beads were suspended in 200 µl exonuclease I mix (containing 1x exonuclease I buffer and 1 U/µl exonuclease I (NEB, cat #B0293S)), and incubated at 37ºC for 45minutes to remove oligonucleotides which did not capture mRNA. Beads were pooled and washed once with 200 µl TE-SDS, once with 200 µl TE-TW and once with 200 µl 10 mM Tris pH 7.5 (or ultrapure distilled water).
cDNA amplification
Beads were then distributed to 5 tubes. Every tube was added with 20 µl PCR mix, which includes 1x HiFi HotStart Readymix (Kapa Biosystems, cat #KK2602) and 0.4 µM TSO_PCR primer (see Table 1). The PCR program was as follows: 98ºC for 3 min, 14 cycles of (98ºC 20sec, 67ºC 15sec, 72ºC 6 min), 72ºC 5 min and 4ºC hold. Shake the PCR tube to mix the beads (first cDNA template) at the end of 98ºC in the first four cycles (important!). After pooling all PCR products, AMPure XP beads (Beckman Coulter, cat #A63881) were used to purify the cDNA library.
Transposase fragmentation and selective PCR
Prepare 3'-end cDNA fragments for sequencing by Nextera XT tagmentation reactions (Illumina, cat#FC-131-1096). Fragmentation reaction was done following the instructions of manufacturer. We replace the index 2 primers (N5xx) in the kit with our P5 primer (see Table 1) to specially amplify fragments which contain the 3' end of transcript. Other fragments will form self-loops, which impede their binding to PCR primers. PCR program is as follows: 72ºC 3 min, 98ºC 30 sec, 13-15 cycles of (98ºC 15 sec, 60ºC 30 sec, 72ºC 3 min), 72ºC 5 min and 4ºC hold. To eliminate primer dimer and large size fragments, 0.6 x AMPure XP beads were then used to purify cDNA library. Then size distribution was analyzed on an Agilent 2100 bioanalyzer, a peak at around 400~700bp range should be observed. Finally, the libraries were sequenced on the Illumina NextSeq 500 using 3 µl of 100 µM Read1CustSeq (see Table 1) for priming of read 1.
Table 1 Primer used in Microwell-seq
| Primer | Sequence |
|---|---|
| TSO_RT primer | AAGCAGTGGTATCAACGCAGAGTGAAT/rG/rG/iXNA_G |
| TSO_PCR primer | AAGCAGTGGTATCAACGCAGAGT |
| P5 primer | AATGATACGGCGACCACCGAGATCTACACGCCTGTCCGCGGAAGCAGTGGTATCAACGCAGAGT*A*C |
| Read1CustSeq | GCCTGTCCGCGGAAGCAGTGGTATCAACGCAGAGTACGT |
About MCA
We used single-cell RNA sequencing to determine the cell type composition of major mouse organs and construct a basic scheme for the Mouse Cell Atlas (MCA). To allow for public access of the resource, we created a Mouse Cell Atlas (MCA) website at http://bis.zju.edu.cn/MCA/.
MCA website consists of seven web pages.
1. Home: This page contains three sections. About describes the functions and update of the MCA website, Mouse tissue info gives a brief description of each organization of the sample, Microwell-seq protocol describes how Microwell-seq operates.
2. Atlas: In MCA 1.0, we analysed >400,000 single cells from >10 mouse tissues (2-4 replicates per tissue in general). In a global view of MCA 1.1, the complete mouse tissue dataset are grouped into 104 major clusters. In MCA 2.0 (Mouse Cell Differentiation Atlas), we analysed >520,000 single cells from >10 mouse tissues (2-4 replicates per tissue in general) at seven life stages (E10.5, E12.5, E14.5, P0, P10, P21, adult) from early embryonic stage to the mature adult stage. In a global view, the complete mouse tissue dataset are grouped into 95 major clusters. In MCA 3.0 (Mouse Cell Development and Ageing Atlas), we analysed ~1,130,000 single cells from >10 mouse tissues (2-4 replicates per tissue in general) at ten life stages (E10.5, E12.5, E14.5, Neonatal, 10d, 3w, 6~8w, 12m, 18m, 24m) from early embryonic stage to the mature adult stage. In a global view, the complete mouse tissue dataset are grouped into 177 major clusters.We created this page to achieve better visualization for global view. You can view each group, each tissue and each gene by choosing the optional box on the left. Atlas view provides global view on single cell level, Marker list provides marker genes for each cluster.
| MCA version | Name | Tissues | Stages | Cells | Clusters | Link |
|---|---|---|---|---|---|---|
| MCA 1.0 | Mouse Cell Atlas | 51 mouse tissues, organs, and cell cultures | Adult (6-10w), E14.5 (fetal), neonatal | >400,000 | 98 | Han et al. |
| MCA 1.1 Explore Atlas |
Mouse Cell Atlas | 55 mouse tissues, organs, and cell cultures (Add more tisses in MCA 1.0) |
Adult (6-10w), E14.5 (fetal), neonatal | 333,778 Re-cluster the updated MCA with HCL pipeline. |
104 | Han et al. Explore Atlas |
| MCA 2.0 Explore Atlas |
Mouse Cell Differentiation Atlas | >10 mouse tissues | E10.5, E12.5, E14.5, P0, P10, P21, adult | >520,000 | 95 | Fei et al. Explore Atlas |
| MCA 3.0 Explore Atlas |
Mouse Cell Development and Ageing Atlas | >10 mouse tissues | E10.5, E12.5, E14.5, Neonatal, 10d, 3w, 6-8w, 12m, 18m, 24m | >1,130,000 | 177 | Wang et al. Explore Atlas |
3. Gallery: In the Gallery, you can download the single-cell digital gene expression (DGE) matrix and get information of the cell number and sample source for each data. The results of the clustering analysis with marker genes are also shared on the Gallery.
4. Search: This page includes two search methods: Search tissue and Search atlas. In Search tissue, You can search genes in the sample you selected. The bar chart of the gene expression will be returned. In Search atlas, You can search genes in the complete MCA dataset. The bar chart of the gene expression in top 20 cell types, tissues and stages will be returned.
5. Run-scMCA: You can upload the DGE matrix of RNA-seq data (scRNA-seq data or bulk RNA-seq data) and the scMCA can help you to identify cell types in your data. The results are showed by interactive heatmap and table in csv format. In heatmap, the row means the defined cell type, the column means the query sample, and the color of block indicates the strength of the correlation. In the result table, Pearson correlation coefficients between query samples (to be identified) and reference cell types are provided.
6. FAQ: Some frequently asked questions are listed on this page.
7. Contact: Download links for data and contact information for data providers are placed in this page. We also provide message board on this page.
News
On Aug, 2022: Article online:
Wang, R. et al. Construction of a cross-species cell landscape at single-cell level. Nucleic Acids Research https://doi.org/10.1093/nar/gkac633 (2022).
On July 11, 2022: Article online:
Fei, L. et al. Systematic identification of cell-fate regulatory programs using a single-cell atlas of mouse development. Nature Genetics https://doi.org/10.1038/s41588-022-01118-8 (2022).
On Jun 24, 2022: MCA Version 3.0 released.
On Sep 29, 2021: MCA Version 2.0 released.
On Feb 22, 2018: Article online:
Han, X. et al. Mapping the Mouse Cell Atlas by Microwell-Seq. Cell https://doi.org/10.1016/j.cell.2018.02.001 (2018).
On June 30, 2017: MCA Version 1.0 released.