


E.G.: LOC_Os03g04960.1, Q0JRD6, Os01g0100900.
PRIN Help
What is interolog?
Interolog is a computational protein-protein interaction prediction method is based on the theory of evolutionary conservation of protein, which is known as ortholog. The interolog method is mainly dependent on the protein ortholog algorithms such as InParanoid. InParanoid compared all the protein sequence pairs in a species through InParanoid’s own algorithm, which is based on blast calculation but not simply best blast score. The highest similarity protein is selected as a candidate protein, ensuring that there is no other protein and its candidate protein has a higher similarity. All orthologous proteins in two species are obtained through such a screening methods.
Our multi-species interolog method is based on a simple logical principle (shown in Figure 1): if ‘protein A’ and ‘protein B’ in a specific specie are orthologous with ‘protein A1’ and ‘protein B1’ separately in another species, and the interaction of ‘protein A1’ and ‘protein B1’ has been verified experimentally in the reference species, ‘protein A’ and ‘protein B’ are predicted to interact with each other. If interolog of protein A and protein B is found in more than one species, the reliability of interaction between them is increased.
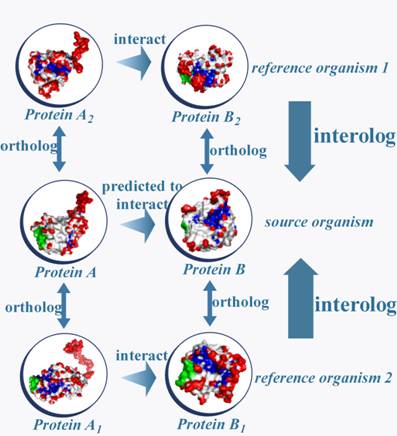
Figure 1
Multi-species interolog detection. Interolog method based on multi-species considers evolution conservation between protein interaction pairs, and naturally has better sensitivity in cross species prediction.
How to search proteins?
A protein can be queried by its symbol name, Loc number, or UniProt accession in the Protein Search page. PRIN will return all the proteins which are predicted to interact with the submition.
How to search interactions
If you have a list of proteins and want to know whether they interact between each other, just paste this list of proteins into the submit box of Interaction Search page. PRIN will return all the interactions involving these proteins.
How to read the results?
PRIN provide “Gene Ontology”, “Cross-database”, and “Protein interactions” for protein search; “Interaction Details”, “Interacted Proteins”, ”Colocalization”, ”GO Annotations”, ”Co-Expression”, ”RSS GO” and “Interologs” for interaction search. Figure 2 gives a graphic solution for these two results.
What is Co-expression Pearson Correlation Coefficient score?
The Pearson correlation coefficient of two rice genes are obtained from the RiceArray Database calculation based on rice gene expression data in 830 rice Affymetrix microarray data (NCBI GEO AC: GPL2025). Since there are only 34,016 rice genes have unique match in Affymetrix probeset, 35% of protein pairs in our predicted rice interactome successfully mapped to co-expression Pearson Correlation Coefficient score. If gene A and gene B are the given two genes, Xi and Yi are the gene expression level of A and B in time i, the Pearson Correlation Coefficient score (ɣ) can be given as follows:
![]()
Where ![]() mean the
average gene expression amount during time m, σx and σy
means the standard deviation of gene expression amount during time m. The value
of ɣ drops into -1 ~ 1, and -1 means gene expression patterns of A and B are
opposite (a expression increased, the other down); 1means that gene expression
patterns of A and B are consistent (a expression increased, the other up); 0
means that gene expression patterns of A and B are without any contact. Since
interacting proteins may be mutually reinforcing (corresponding to ɣ
> 0), may also be inhibited each other (corresponding to ɣ <0), so
we use the absolute value of ɣ as a co-expression property between a
predicted protein interaction.
mean the
average gene expression amount during time m, σx and σy
means the standard deviation of gene expression amount during time m. The value
of ɣ drops into -1 ~ 1, and -1 means gene expression patterns of A and B are
opposite (a expression increased, the other down); 1means that gene expression
patterns of A and B are consistent (a expression increased, the other up); 0
means that gene expression patterns of A and B are without any contact. Since
interacting proteins may be mutually reinforcing (corresponding to ɣ
> 0), may also be inhibited each other (corresponding to ɣ <0), so
we use the absolute value of ɣ as a co-expression property between a
predicted protein interaction.
What is RSSGO score?
Three independent Gene Ontologies (biological process, molecular function and cellular component) for proteins in PRIN are obtained from the Gene Ontology database and Gramene database. Term description was obtained from Gene Ontology database for network clustering. UniProtKB-GOA GO Slim is chose to construct catalog for GO terms, and GO Slim Viewer provided by AgBase are taken to calculate the distribution of Go terms in our networks. Relative specificity similarity (RSS) score of protein pairs in PRIN based on GO annotation had been calculated to evaluate of the reliability of the predicted rice protein-protein interaction. We applied tools provided by SPIDer to calculate the RSSGO score between two given GO terms.
RSS score can be defined as:
α measures specificity between two GO terms (term i and term j) of a given protein, protein A, and α can be defined as:
![]()
β measures how relatively general term i and term j are in the GO and β can be defined as:
![]()
U = {all leaf nodes descending from term i} and V = {all leaf nodes descending from term j}
ɣ measures the local distance between two terms relative to the given protein, and ɣ can be defined as:
![]()
And to a given interacted protein pair, protein A and protein B, terms(A) and terms(B) are all the GO terms corresponding to protein A and B. RSSGO(A, B) is defined as the correlation strength between A and B:
![]()
Three independent RSSGO scores are given. With a certain cut off of 0.8, larger RSSBP score indicates two proteins have stronger correlation in biological processes; larger RSSCC score indicates two proteins have more similarity of characteristics of cell components; larger RSSMF score indicates two proteins are more similar in molecular functions.
How to site us?
Gu H.B., Zhu P.C., Chen M.: PRIN: a pedicted rice interactome network. BMC Bioinformatics,2011 (submitted).