The scanpy h5ad file of Fig1 can be downloaded
here.
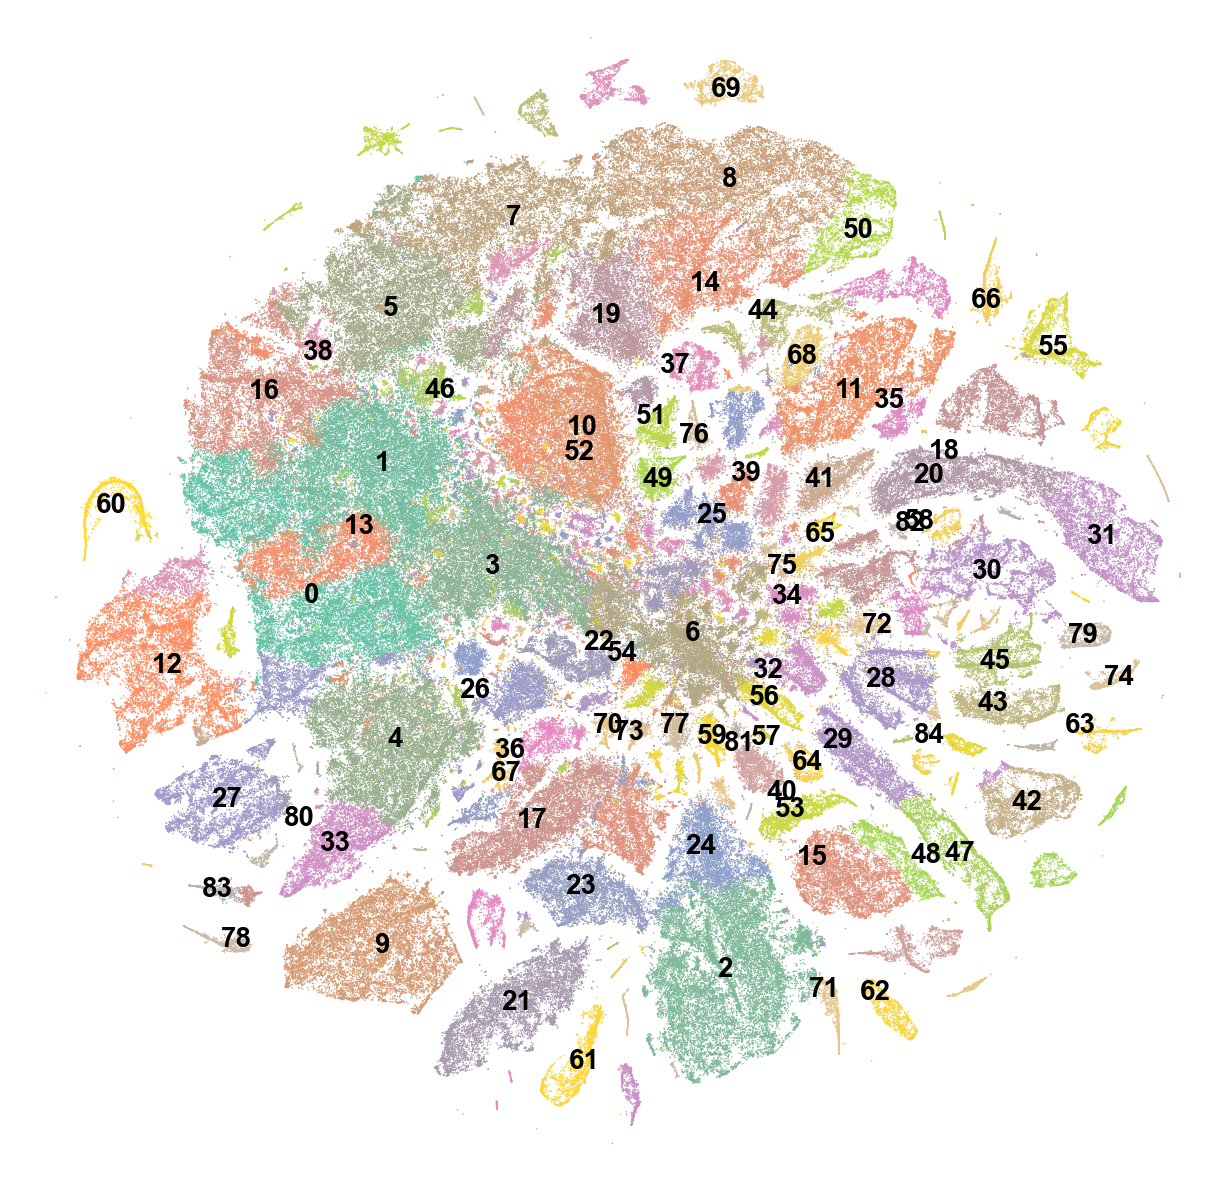
The markerlsit file of Fig1 can be downloaded here.
These are marker genes for each cluster.
P-val: p-values.
LogFC: The log2 fold change for each gene for each cluster.
Scores: The z-score underlying the computation of a p-value for each gene for each cluster.