1. Introduction
HEMA is a multi-level integrated single-cell database focused on hematopoietic system development across multiple species. It contains data from human, mouse, zebrafish, macaque, rabbit, frog, fruit fly, and ascidian, providing valuable insights into the intricate processes of hematopoiesis at the single-cell level. The database integrates high-quality scRNA-seq samples at multiple levels in the context of different replicates, stages, tissues, and genotypes. A user-friendly dashboard (see video in Modules section) was developed for interactive visualization of each integrated project or atlas. The dashboard presents versus detail tables and interactive plots to facilitate data exploration, including meta-information, UMAP plot, cell composition, cell quality, dot plot, feature plot, violin plot and functional enrichment results. With its user-friendly interface and powerful visualization tools, HEMA serves as an essential platform for investigating the conserved mechanisms and species-specific differences in hematopoietic development, facilitating comparative analyses and advancing our understanding of blood cell formation and development among species, from invertebrates to mammals.
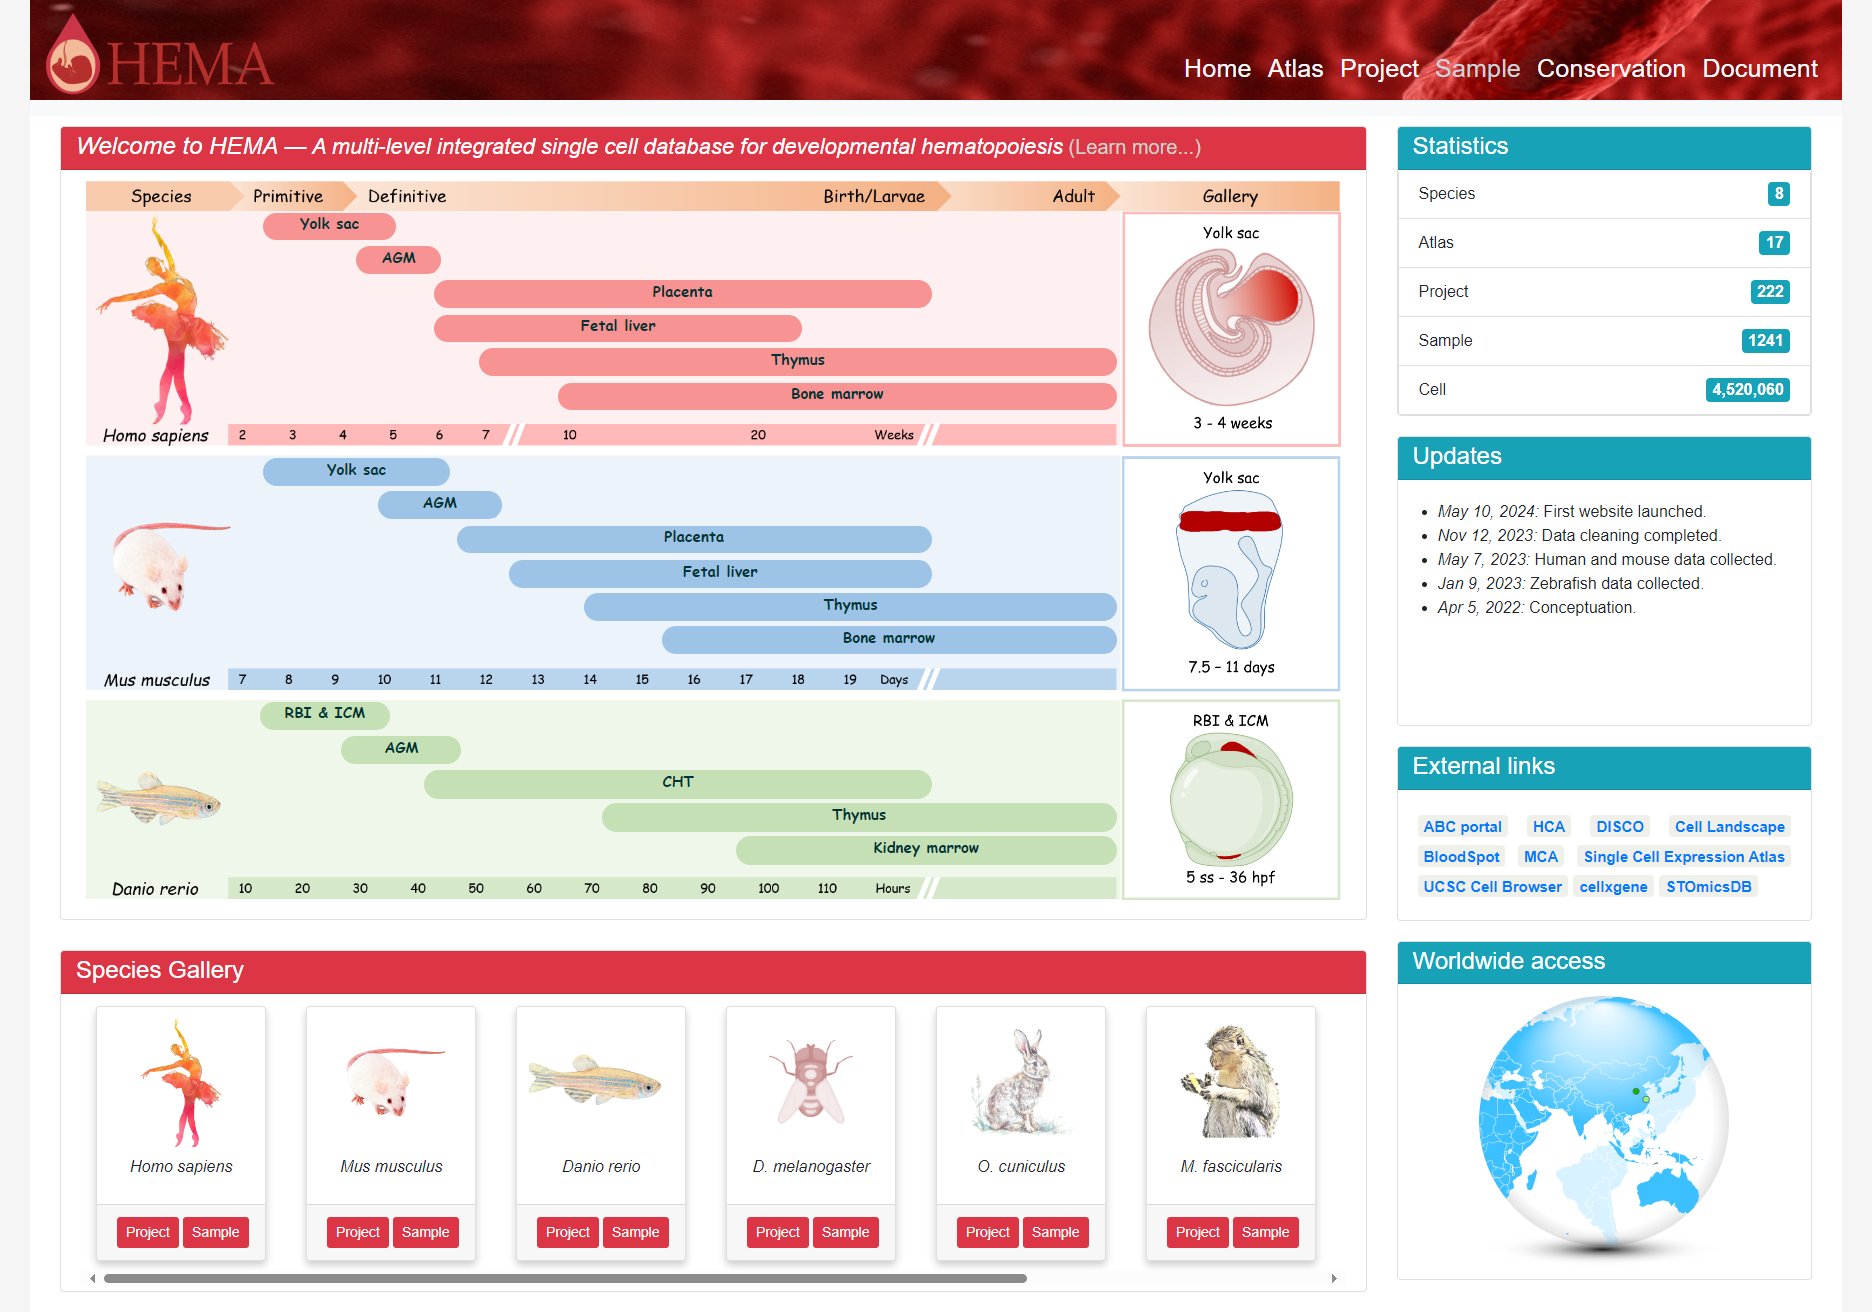
2. Homepage
HEMA homepage features a user-friendly layout that guides visitors through the wealth of hematopoietic development stages and tissues available. The top-left section showcases the main content, focusing on the critical time points and key anatomical sites of hematopoiesis in human, mouse, and zebrafish embryos. Interactive buttons representing each organ/tissue allow users to quickly access the corresponding datasets, enabling seamless navigation and exploration. Below this, a comprehensive overview of the data from all species is presented, providing researchers with a broad perspective on the available resources. On the right side, visitors can find informative statistics about the database, including the number of species, samples, and cells, as well as details on the latest updates and improvements. This intuitive layout ensures that users can easily locate and access the desired information, whether they are interested in specific species or seeking a general understanding of the database's content and scope.
3. Modules
3.1 Sample
The Sample page is a central repository for all hematopoiesis-related single-cell datasets in the HEMA database. The HEMA team has meticulously curated and corrected the meta-information for each sample, ensuring data accuracy and reliability. Datasets are divided into the smallest possible samples based on criteria such as developmental stage, tissue type, genotype, and flow cytometry sorting strategies, allowing researchers to easily identify and select the most relevant samples for their research. The well-curated and standardized samples on the Sample page facilitate seamless integration of single-cell datasets across studies and platforms, enhancing the reproducibility and comparability of analyses. Researchers can use these samples as standard inputs for their own data integration pipelines. The user-friendly interface enables easy browsing and filtering of datasets based on various metadata attributes, allowing users to quickly locate the samples that meet their specific criteria.
3.2 Project
The Project page in the HEMA database integrates homogeneous and heterogeneous samples from the Sample table, providing a collection of manually annotated projects. These annotations are based on original information and marker gene expression, ensuring accuracy and biological relevance. The page features an interactive single-cell dashboard with user-friendly visualizations, allowing researchers to explore various aspects of the integrated data, such as cell type composition, gene expression patterns, and functional annotations. By offering dynamic visual representations, the Project page empowers researchers to gain deeper insights into the biological processes and mechanisms underlying hematopoiesis, facilitating the discovery of meaningful patterns and advancing our understanding of blood cell development. For a detailed demonstration of the interactive visualizations available on the Project page, please refer to the video provided below.
3.3 Atlas
The Atlas page in the HEMA database provides integrated single-cell atlases of the main hematopoietic tissues and organs from human, mouse, and zebrafish. Each atlas is constructed by integrating data from multiple datasets and is manually annotated based on the original annotations and marker gene expression. The single-cell dashboard offers a comprehensive visualization of these atlases, including meta-information, UMAP plots, cell composition, cell quality, dot plots, feature plots, violin plots, and functional enrichment results. Additionally, HEMA includes a 'split by' function that allows users to stratify plots according to different meta-information, enabling the comparison of spatiotemporal dynamics of cell composition and gene expression across continuous developmental stages and different hematopoietic tissues. This feature facilitates the exploration of the dynamic changes and regulatory mechanisms underlying hematopoietic development in different species.
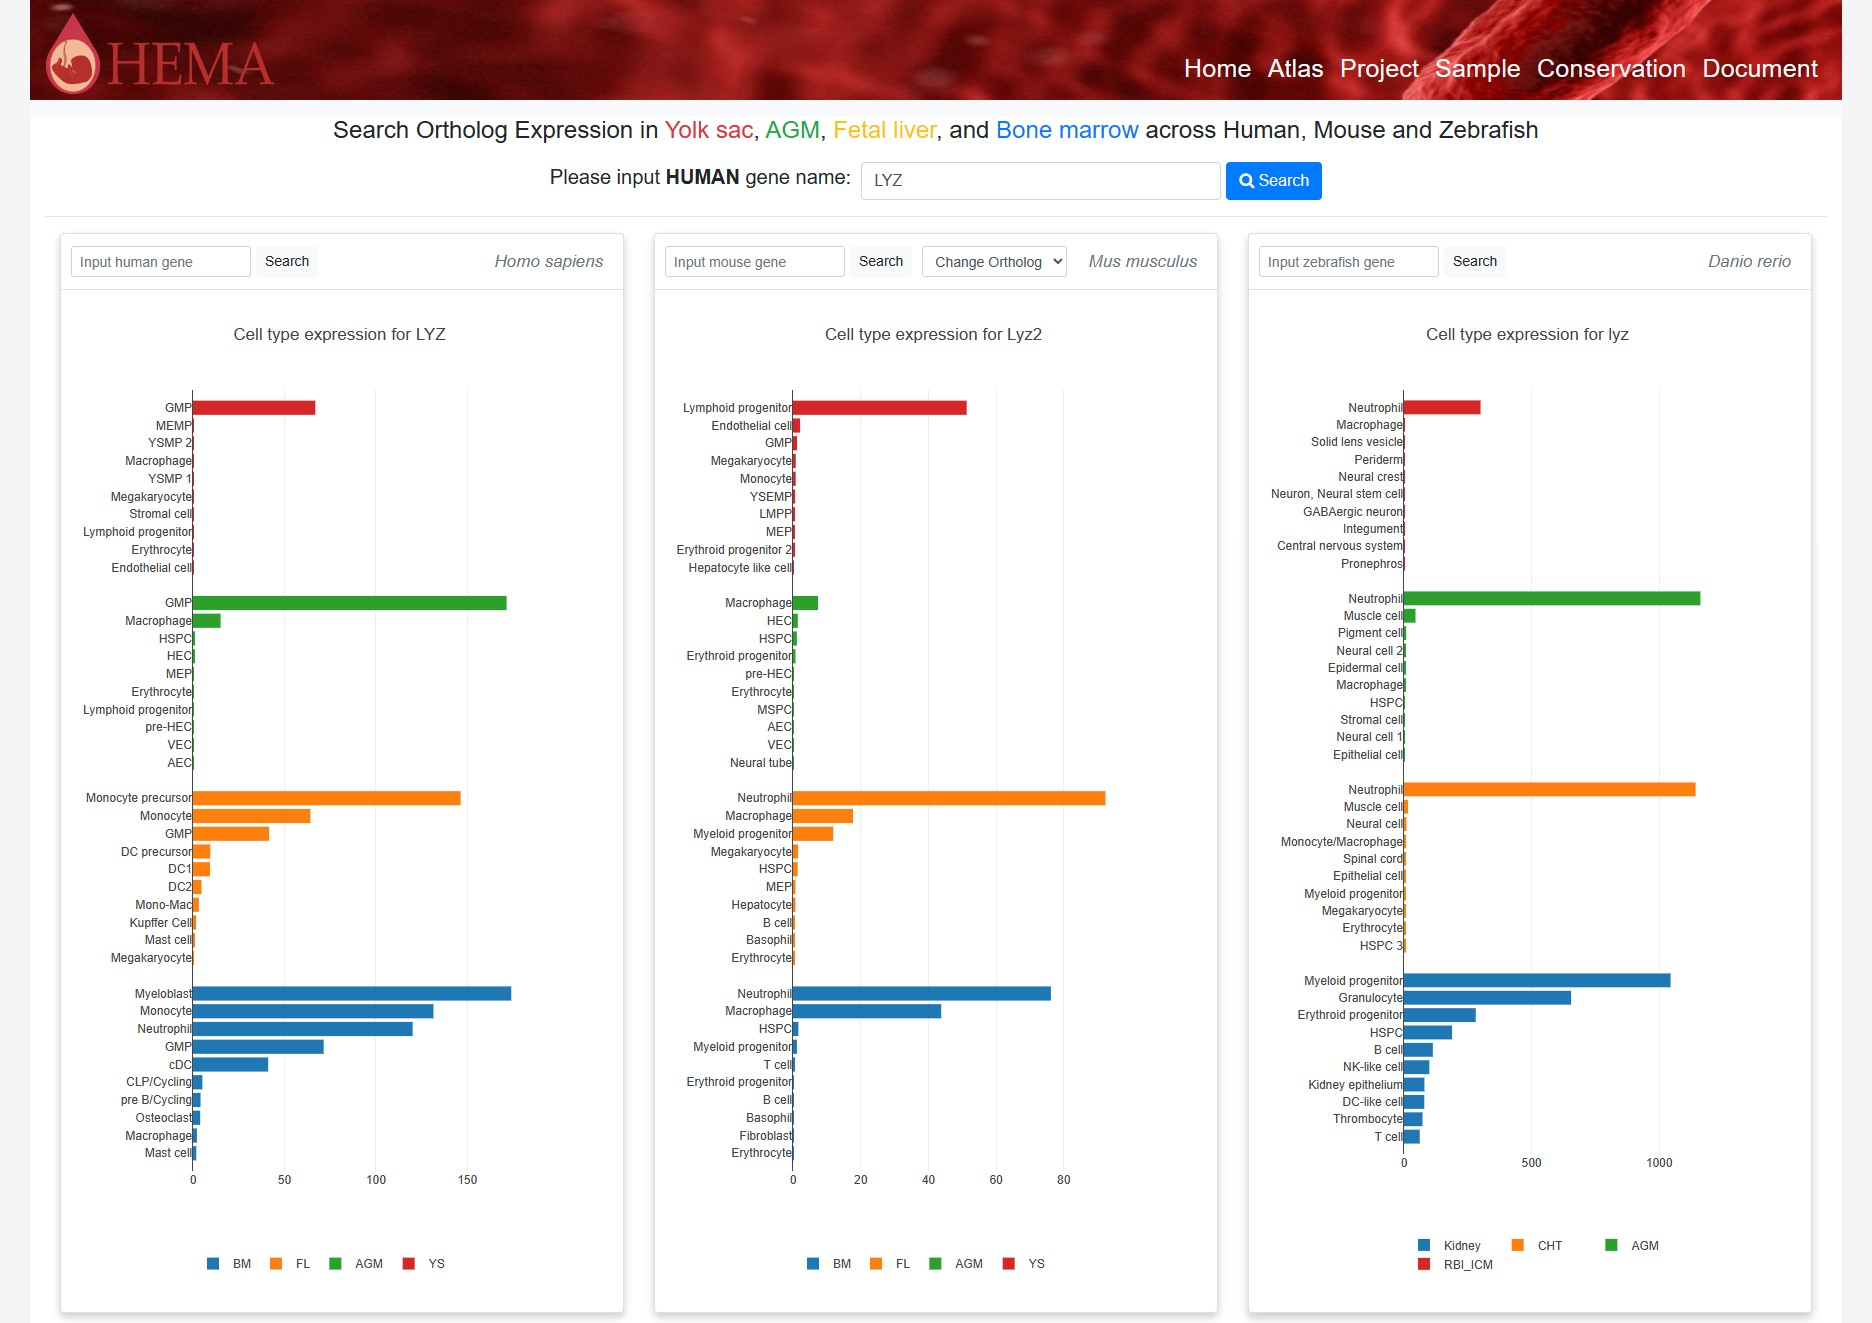
4 Conservation
The Conservation interface in HEMA enables users to explore the conservation of gene expression patterns across cell types in human, mouse, and zebrafish hematopoietic tissues, including the yolk sac, AGM, fetal liver, and bone marrow.