Cell-type-specific genetic variations of gene regulation causally associated to complex traits and diseases.

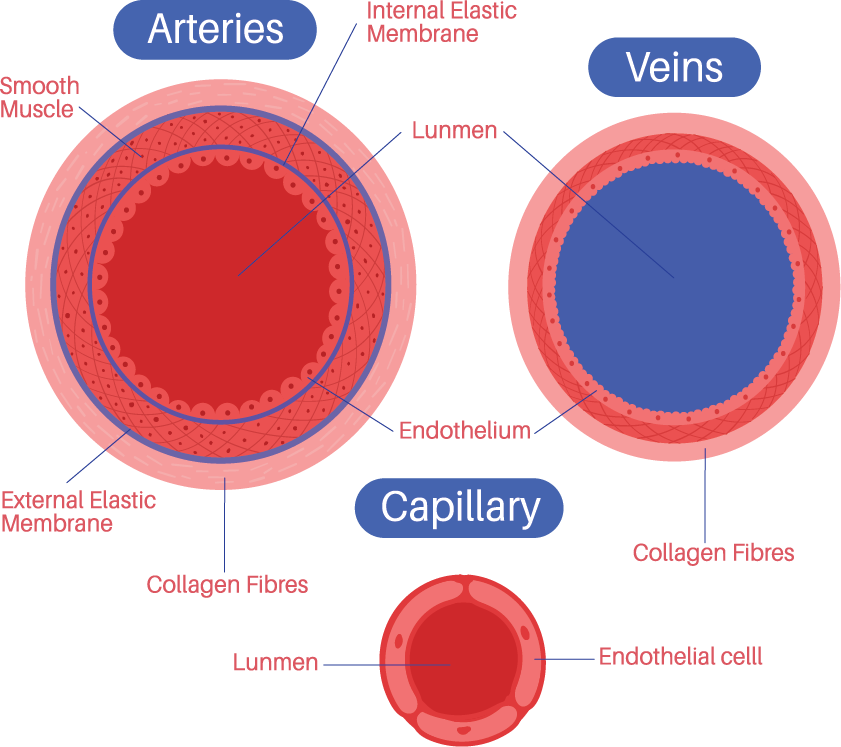
Endothelial
|
|
Endothelial cell (664)
|
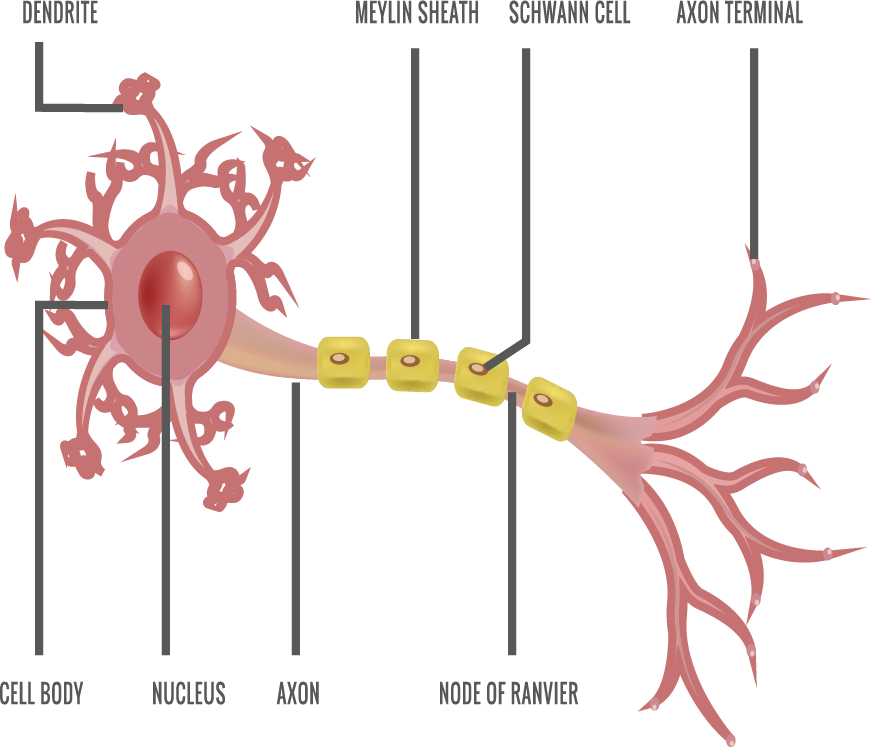
Neuron
|
|
Oligodendrocyte (34)
Neurocyte (14)
|
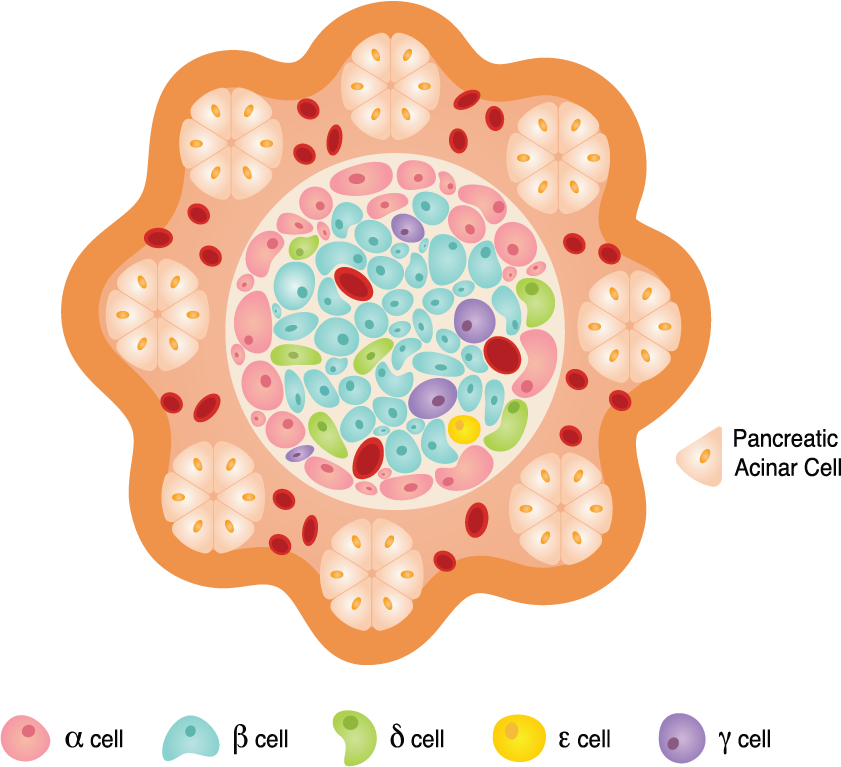
Secretory
|
|
Thyroid follicular cell (105)
Zona fasciculata cell (81)
Gastric chief cell (67)
other 3 cell types
|
Erythroid
|
|
Erythroid cell (123)
|
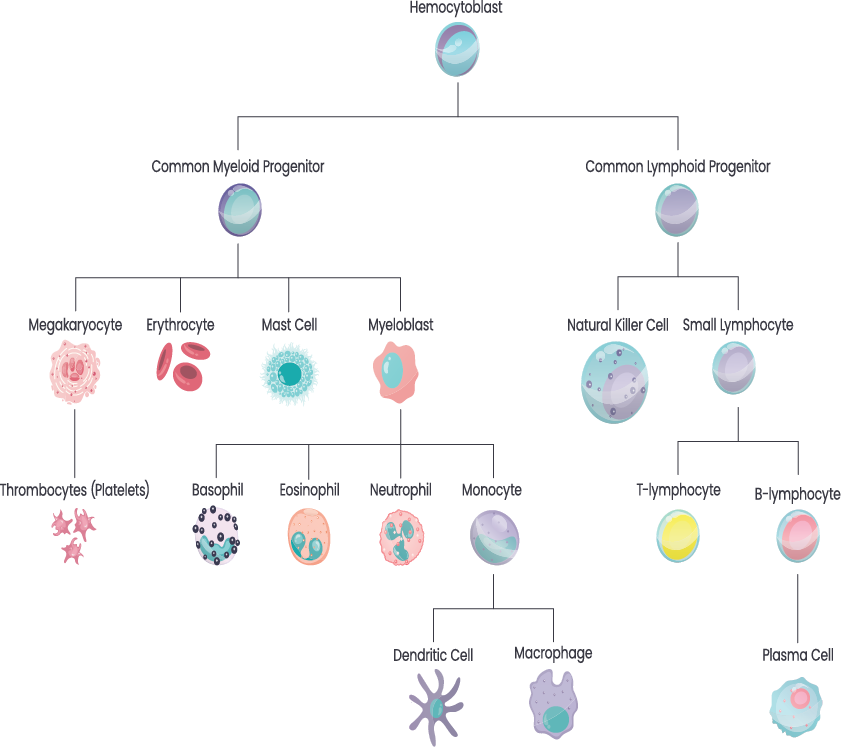
Immune
|
|
B cell (517)
Monocyte (400)
T cell (349)
other 10 cell types
|
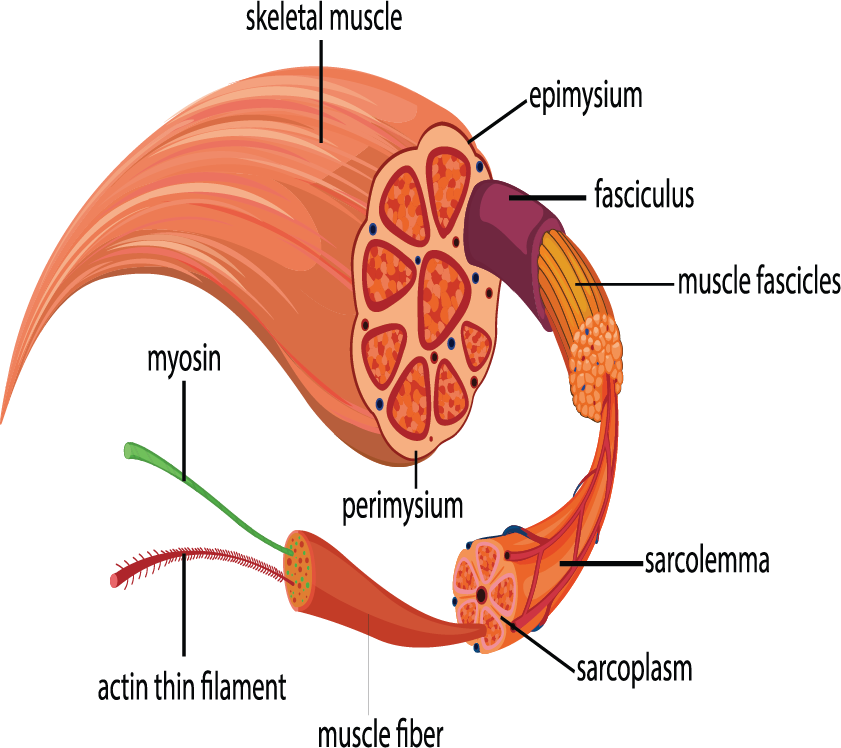
Muscle
|
|
Esophageal smooth muscle cell (252)
Vascular smooth muscle cell (201)
Smooth muscle cell(general) (141)
other 4 cell types
|
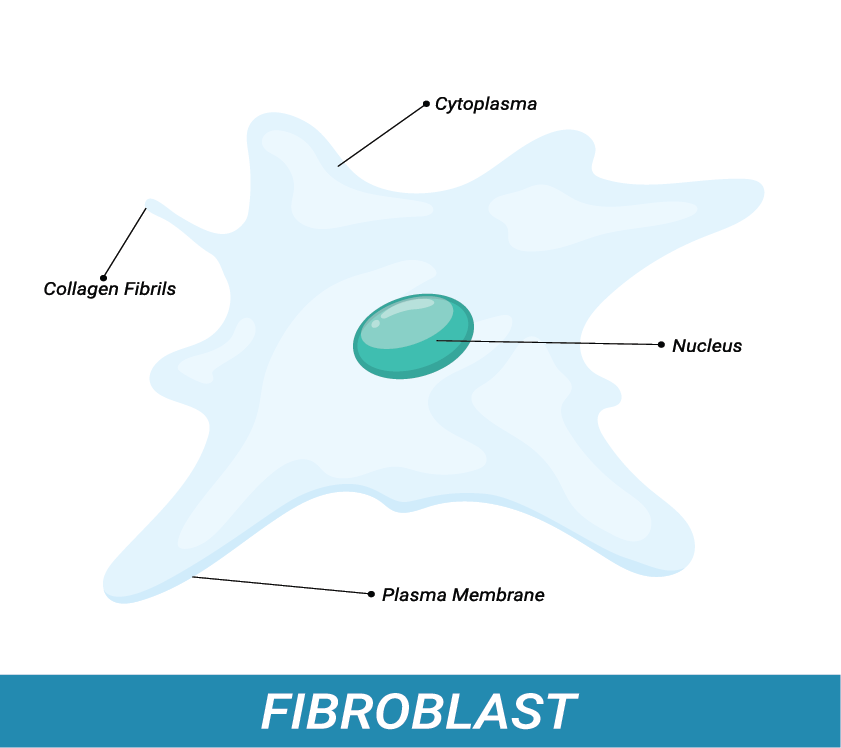
Stromal
|
|
Myofibroblast (204)
Fibroblast (158)
|
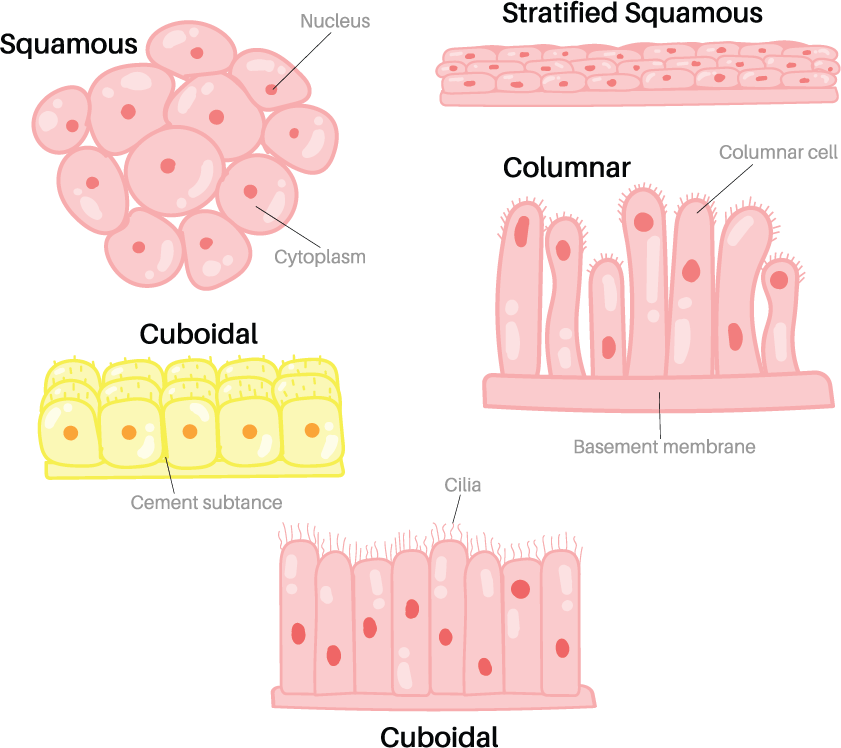
Epithelial
|
|
Stromal cell (160)
Enterocyte (155)
Epithelial cell (142)
other 9 cell types
|
Introduction
The hyperlinks are directed to the relevant pages displaying the function mapping of disease-causal and trait-causal genetic variations to cell-type-specific genetic variations of gene regulation at single-base resolutions. The mapped variants that are considered most likely to contribute to phenotypic variations with a cell-type-specific manner, the fine mapping results (PIPs) of the GWAS loci, the related standard eQTLs or cell cluster-ieQTLs and the inferred candidate genes underlying the biological mechanisms of complex phenotypes can be found.
Data information
- SpeciesHuman
- Cell lineage8
- Major cell type44
- Mapped functional variants699
- Candidate functional gene672
External Links