Documentation
1. Introduction
HALD (Human Aging and Longevity Database) is a human aging and longevity knowledge graph generated by an integrated text-mining pipeline, including literature retrieval, named entity recognition, and relation extraction. Human aging and longevity biomarkers were further identified by investigating the characteristics of the relations between gene, RNA, protein, carbohydrate, lipid, peptide, pharmaceutical preparations, toxin, mutation entities and disease entities.
2. Homepage
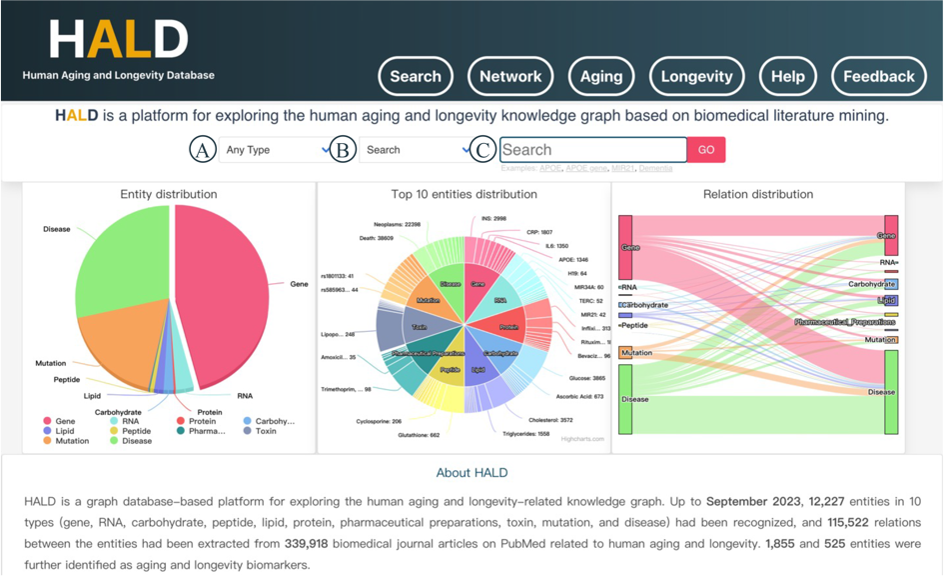
On the homepage, you can choose one type of entity (Figure 1A) and one module of result in the checkboxes (Figure 1B), enter your interested terms in the input box (Figure 1C), and click the ‘GO’ button to achieve a general search and it will jump to a new page to display the targeted module information. In particular, the input box is characterized by autocomplete function to prompt the full name of the relevant entity. Highcharts is introduced to design the pie chart of the entity distribution, the donut chart of the top 10 entities distribution and the Sankey diagram of the relation distribution. The navigation bar is divided into 6 modules: Search, Network, Aging, Longevity, Help and Feedback.

3. Modules
3.1 Search
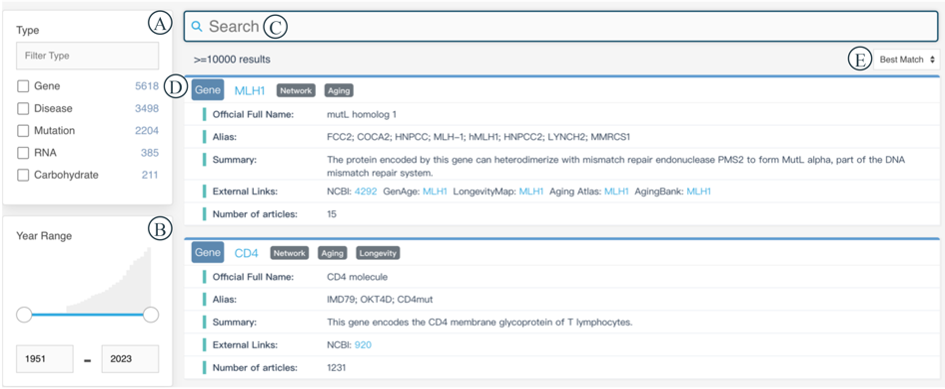
The Search module offers a general search of the knowledge graph and is divided into three parts: filter part (Figure 2A and 2B), search part (Figure 2C) and result part (Figure 2D). The filter part consists of the multiple selection list box of 10 entity types (Figure 2A) and the year range of the literature publications (Figure 2B). The search part is an autocomplete search input box that accepts entity name, alias name and type name separated by space (Figure 2C). Best match, most, and latest options can be selected to show the results with the best match, the most literature, and the latest published literature corresponding to the input entity (Figure 2E). In the result part, the first line displays the entity name, and Network, Aging and Longevity labels appear behind the entity name depending on whether the entity exists in these modules (Figure 2D). Brief information about the entity including Official Full Name, Alias, Summary, External Links, Number of Articles, MeSH ID, Alleles and Position is demonstrated on each line of the box. It is worth mentioning that these three parts have a mutual reaction once each of their states changes.

The hyperlink of the entity name leads us to a specific page displaying detailed information about PMID, Source, Type, Journal Title (JT), Journal Title Abbreviation (TA), Date of Publication (DP), Year, Journal Impact Factor (IF), Five-year Journal Impact Factor (IF5) and Sentence (Figure 3). Considering that lengthy column names may affect user experience, some columns are represented by abbreviated letters. You can hover your mouse over the question mark icon behind the abbreviated letters to view the full name of the column (Figure 3A). Each column can be sorted by clicking on the column header. You can select items of interest in Figure 3B and download them by clicking the 'Download' button in Figure 3C.

3.2 Network
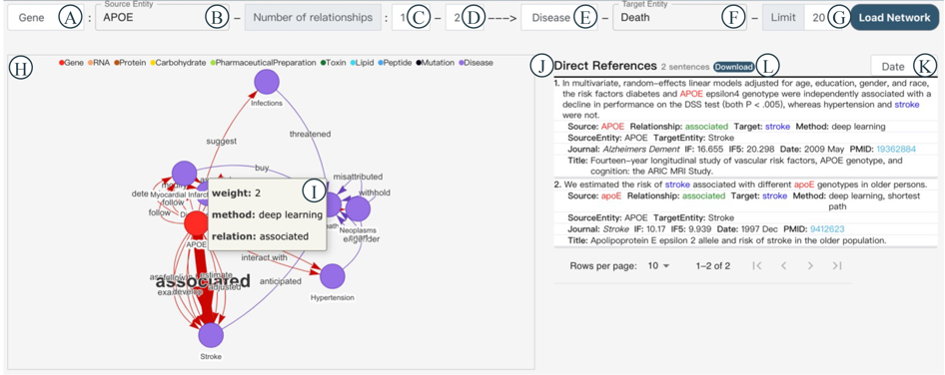
The Network module introduces Neo4j to visualize the relations between entities, in which relations serve as edges while the source and target entities serve as nodes. You can choose a source entity type in Figure 4A, input the source entity name in Figure 4B, specify the minimum and maximum number of relationships in Figures 4C and 4D, select a target entity type in Figure 4E, input the target entity name in Figure 4F, specify the number of relationships to display in Figure 4G, and then click the 'Load Network' button. The network graph will be displayed in Figure 4H, with different entity types represented by distinct colors at the top. When you hover your mouse over a node, a tooltip will show the entity's name, frequency, and type. When you hover over an edge, a tooltip will display the relationship's method, weight, and type. In the same canvas, thicker edges represent relationships that appear more frequently in different literature sources, and the total count of these relationships is reflected in the weight value (Figure 4I). Clicking on a node or edge will immediately display interactive reference information in Figure 4J. Each entry includes Sentence, Source, Relationship, Target, Method, Source Entity, Target Entity, Journal, IF, IF5, Date, PMID, and Title.You can filter the results in Figure 4K based on Date, IF, or IF5. You can also download all the reference information using the 'Download' button in Figure 4L.

For example, if you want to explore 1 to 2 connecting relationships between the gene APOE and the disease Death, and you want to limit the display to only 20 relationships, you can input the information as shown in Figures 4A to 4G. In Figure 4H, you'll see the network graph, and when you hover over the thickest edge, you'll find that the relation 'associated' has a weight of 2 (Figure 4I). Clicking on that edge, Figure 4J will display all reference information related to the triple entity 'APOE-associated-Stroke'.
3.3 Aging
You can browse, filter, and download biomarkers of human aging on this page. When you enter the interface, it defaults to displaying relevant literature published in the last five years. In Figure 5A, you can filter by start and end years, and the corresponding information for the selected years will be displayed below. This information includes Source Entity, Relationship, Target Entity, Source, Source Type, Target, Target Type, PMID, JT, TA, DP, Year, IF, IF5, and Sentence. Considering that lengthy column names may affect the user experience, some columns are represented by abbreviated letters. You can hover your mouse over the question mark icon behind the abbreviated letters to view the full name of the column (Figure 5B). Each column can be sorted by clicking on the column header. You can select items of interest in Figure 5C and download them by clicking the 'Download' button in Figure 5D.

3.4 Longevity
You can browse, filter, and download biomarkers of human longevity on this page. When you enter the interface, it defaults to displaying relevant literature published in the last five years. In Figure 6A, you can filter by start and end years, and the corresponding information for the selected years will be displayed below. This information includes Source Entity, Relationship, Target Entity, Source, Source Type, Target, Target Type, PMID, JT, TA, DP, Year, IF, IF5, and Sentence. Considering that lengthy column names may affect the user experience, some columns are represented by abbreviated letters. You can hover your mouse over the question mark icon behind the abbreviated letters to view the full name of the column (Figure 6B). Each column can be sorted by clicking on the column header. You can select items of interest in Figure 6C and download them by clicking the 'Download' button in Figure 6D.

3.5 Feedback
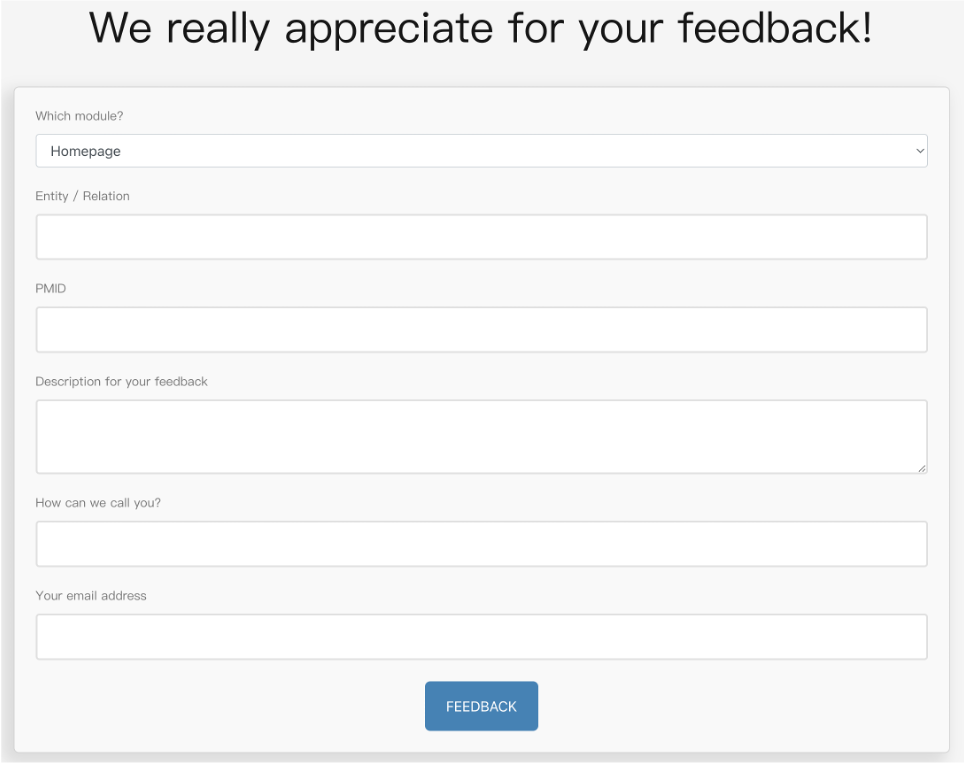
Users are welcome to contribute data and give suggestions in the Feedback module on the website at any time, by directly filling the form and click the "FEEDBACK" button to submit it (Figure 7). Information about part, entity/relation, PMID, description, name and e-mail is included. We will promptly check all the feedback, respond via email, and make necessary adjustments as soon as possible.

4. Download
HALD includes seven sets of files in JSON and CSV formats:
(1) The "Literature_Info.json" file containing the human aging and longevity-related literature information about PMID, title (TI), abstract (AB), journal impact factors (IF), five-year journal impact factors (IF5), author (AU), full author (FAU), affiliation (AD), publication type (PT), date of publication (DP), place of publication (PL), journal title (JT), journal title abbreviation (TA), and source(SO).
(2) The "Entity_Info.json" file containing the information of the entities appearing in the literature about entity, type, official full name, PMID, sentence, numbers of articles, JT, TA, IF, IF5, year, date, alias names, description, url, mutation position, mutation alleles, MeSH ID, relation, external links, aging biomarker, and longevity biomarker.
(3) The "Relation_Info.json" file containing the triples information about source entity, relationship, target entity, method, sentence, source, target, source type, target type, PMID, DP, date, TI, TA, IF, and IF5.
(4) The "Aging_Biomarkers.json" file containing the aging biomarkers information about source entity, relationship, target entity, sentence, source, target, source type, target type, PMID, DP, date, TI, TA, IF, and IF5.
(5) The "Longevity_Biomarkers.json" file containing the longevity biomarkers information about source entity, relationship, target entity, sentence, source, target, source type, target type, DP, TI, TA, IF, and IF5.
(6) The "Entities.csv" file containing the entities information for Neo4j.
(7) The "Roles.csv" file containing the relations information for Neo4j.
These files can be downloaded at Figshare.