Read Me
What's in the name?
PSI-predictor is short for Plant Subcellular-localization Integrative predictor. Incidentally, Psi in Greek (Ψ) also indicates combination and integration (http://en.wikipedia.org/wiki/Psi), which suits perfectly with our study. If you still want to exploit a further step, PSI could also be interpreted as 'People Share Inspirations'. We sincerely hope that people share inspirations both in their research and in life.
Predictable subcellular location
Prediction results are given on cytosol (cytos), endoplasmic reticulum (ER), extracellular (extra), golgi apparatus (golgi), membrane (membr), mitochondria (mito), nuclear (nucl), peroxisome (pero), plastid (plast) and vacuole (vacu). The ten subcellular locations are chosen among the training set with available protein sequence more than 100. Most of the common cellular compartments have been covered by the selected ten subcellular locations (Showed in the figure below).

Dataset
Datasets for training and evaluation were retrieved from SUBA3 [12] and PPDB [13], including 16009 sequences from Arabidopsis and Maize, with 1/5 randomly picked out as test set and 4/5 as training set. Download the dataset here.
Methods
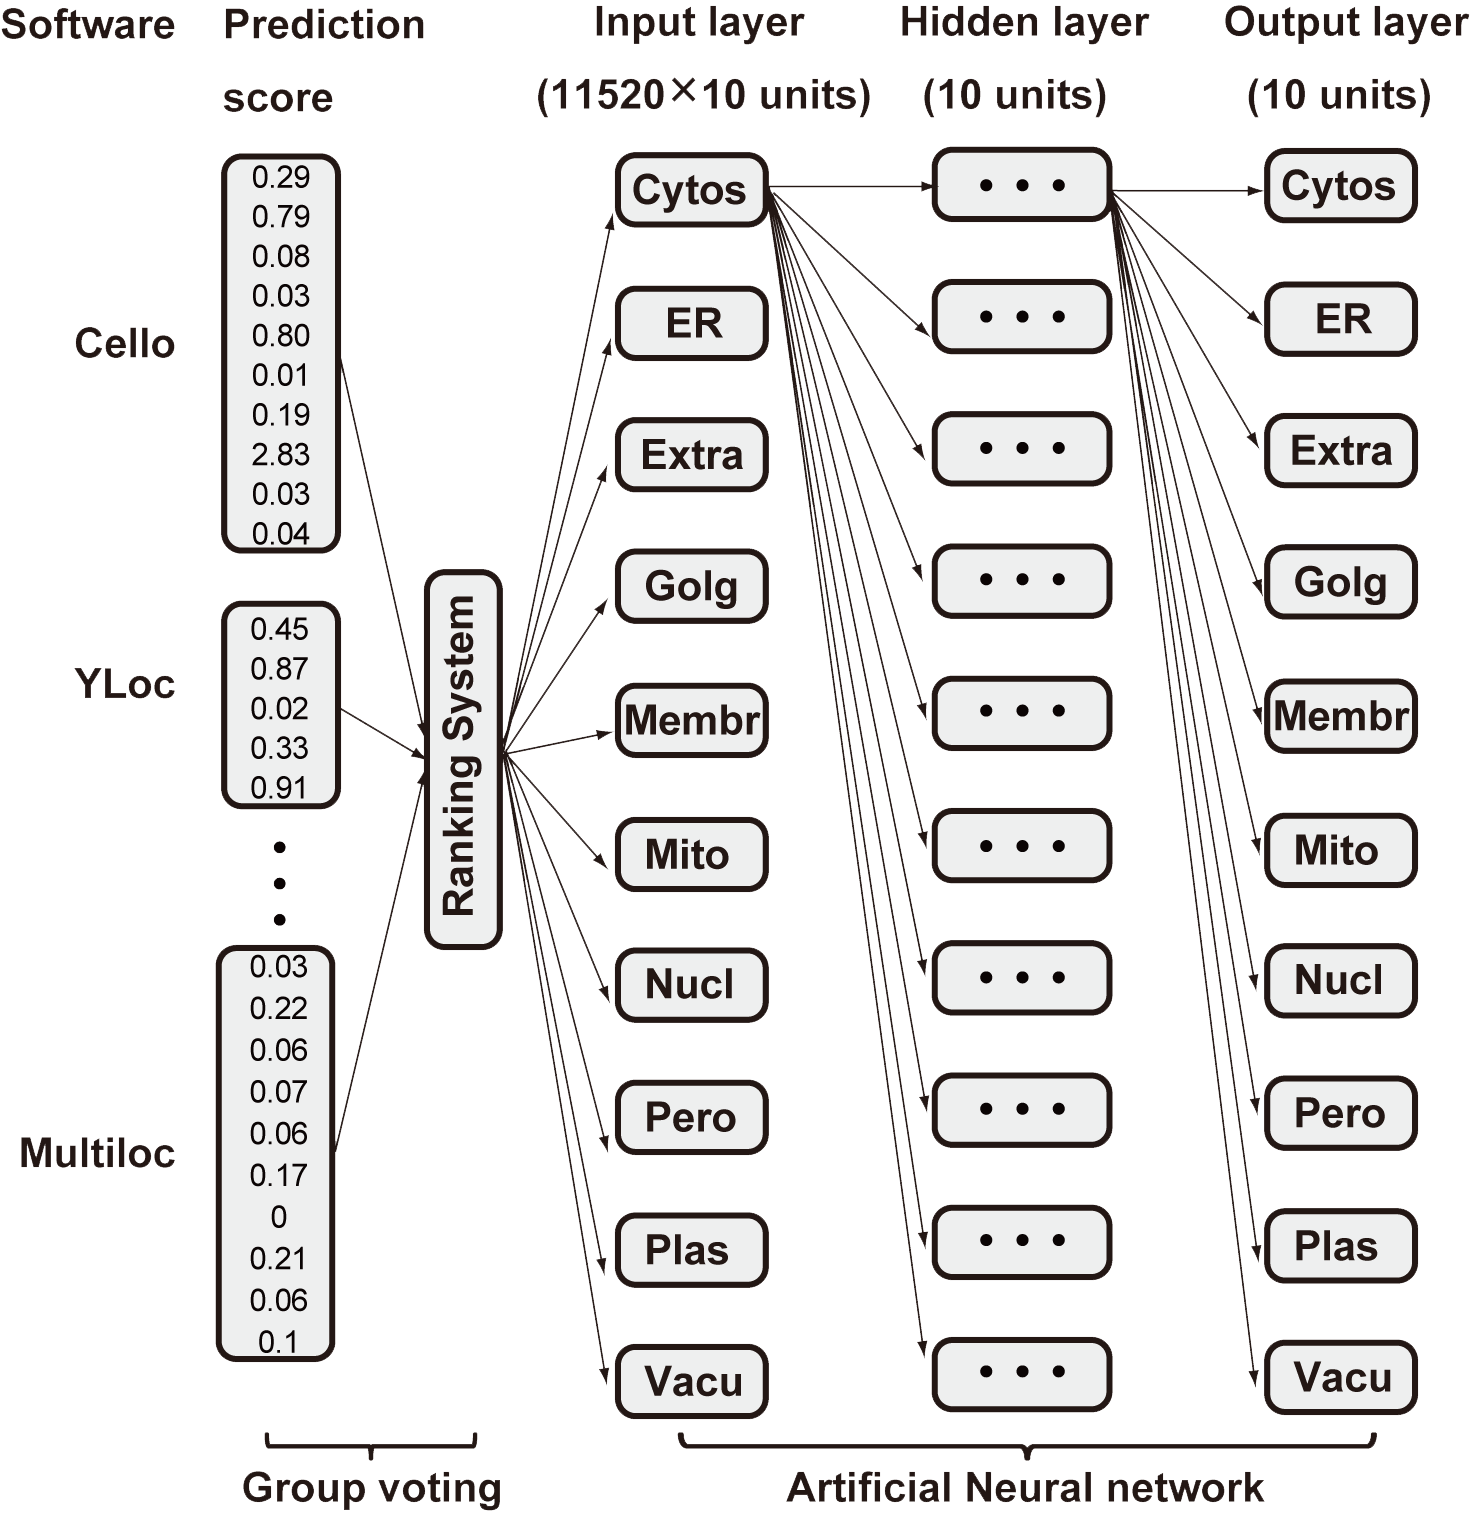
Predictors community consist of cello[1], mPloc[2], Predotar[3], mitoProt[4], MultiLoc[5], TargetP[6], Wolf PSORT[7], subcellPredict[8], iPsort[9], Yloc[10], PTS1[11].
PSI-predictor took the input protein sequence in fasta format, either a pasted sequence or a file (size limit < 500kb). Then predictor results were retrieved and formatted, entered integration algorithm afterwards. Whenever a predictors responds results, a sign of 'ready to use' will appear and hyperlinks to the responded results in a readable format provided by the predictor itself. Integrated prediction results were given when all collection and integration were done. Model of the webserver are illustrated below:

Webserver model
ISPP-server took the input protein sequence in fasta format, either a pasted sequence or a file (size limit < 500kb). Then predictor results were retrieved and formatted, entered integration algorithm afterwards. Integrated prediction results were given when all collection and integration were done. Model of the webserver are illustrated below (left):

Example Output
The final results will be given in a table resembles the one shown above on the right. Each sequence id follows a row of subcellular locations with scores ranging from 0 to 1. Higher scores represent higher confidence of the protein's existence in certain cellular compartments while P-values as the statistical inference in the brackets show the confidence of the results. Downloadable results are provided in txt format. If email address is left previously, an alert mail will be sent as soon as the results are ready.
